Shopify KPIs and Unit Economics: The Numbers That Run a Store
Shopify’s analytics page lists over a hundred metrics. Meta and Google add fifty more each, and Klaviyo another thirty. Most store owners respond by watching revenue and ROAS and hoping the rest sorts itself out. It does not, because revenue is an output and ROAS is a platform’s opinion.
This is the list I actually use. It starts with the economics of a single order, because every other number on the dashboard is either an input to that or a distraction from it. Then the KPIs that move it, grouped by where you find them, with the targets I use at each stage. It applies whether you sell cookies, cosmetics or hats.
Part 1: The unit economics of one order
Before any KPI, work out what one order is actually worth. Take a typical order and subtract everything that only exists because that order happened.
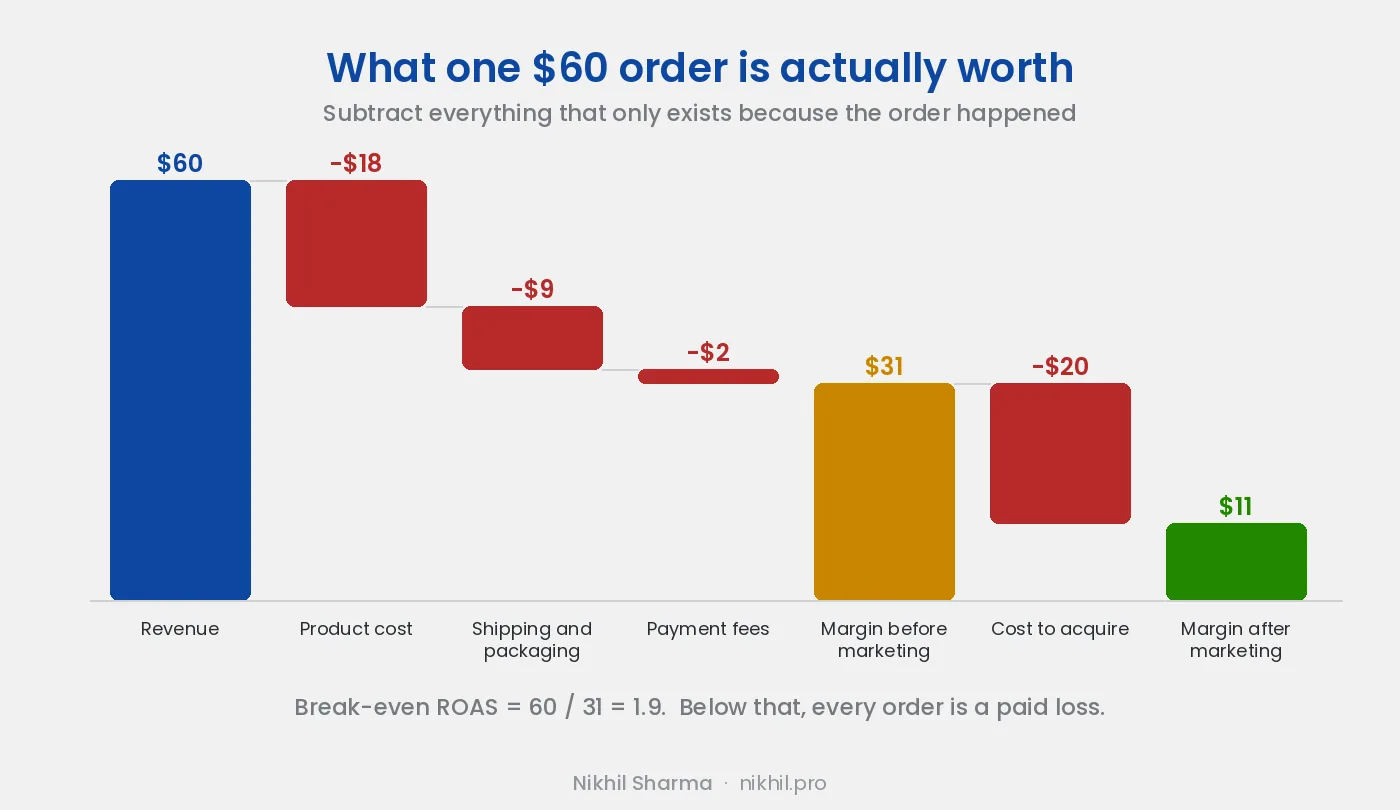
Start with gross margin, which is revenue minus product cost. On the $60 order above the product cost $18, so gross margin is 70 percent. Below 50 percent on a physical product, paid acquisition gets very hard, because there is not enough left after shipping and fees to pay for the customer. Know this number before you run a single ad.
Then keep subtracting. Packaging, the shipping you paid for, payment processing, any per order app fees. What is left is contribution margin before marketing: $31 here, or 52 percent of revenue. That is the pool that pays for advertising, and it gives you the first number most stores have never calculated. Break-even ROAS is revenue divided by that margin. $60 divided by $31 is 1.9. Any campaign running below 1.9 is paying to acquire a loss on that order, and no amount of scale fixes it. This is what makes a ROAS target yours instead of borrowed from a Twitter thread, and it is different for every store.
The next cost is the customer. Customer acquisition cost is total marketing spend divided by new customers over the same period, taken from Shopify’s new versus returning report rather than from the ad platforms. Returning customers do not count, because you did not acquire them this month. Blended CAC includes every channel; paid CAC includes only ad spend. Subtract it from the $31 and you have contribution margin after marketing: $11 on a first order. Positive means the store can grow by spending more. Negative means the store is betting on the customer coming back, and whether that bet pays is the next question.
Customer lifetime value answers it. The useful version is what a customer is worth over twelve months on contribution margin, not revenue: average order margin times orders per customer per year. The formula with discount rates and retention periods that this post used to carry is accurate and nobody uses it. Shopify’s customer cohort report gives you orders per customer by month of first purchase, which is the input that matters. Divide twelve month LTV by CAC and you have the ratio everyone quotes. Three to one is the usual target. Under two to one and the store is funding growth it will not recover. Calculated on revenue instead of margin it is flattering and wrong.
The same inputs give you CAC payback, the months until the margin from a customer covers what they cost. Under three months is comfortable. Over six means every new customer ties up cash for half a year, which is fine for a funded brand and dangerous for one running on last month’s revenue.
The last number in this part is the one I run budgets on. Marketing efficiency ratio is total Shopify revenue divided by total marketing spend across every channel, for the same period, and not from the platforms. Platform ROAS reports what each platform claims. MER reports what the store saw. When Meta’s ROAS goes up and MER goes down, Meta is claiming sales that Google or email produced. On the 700K beauty account MER was the number the budget followed, and the platforms were used to explain it.
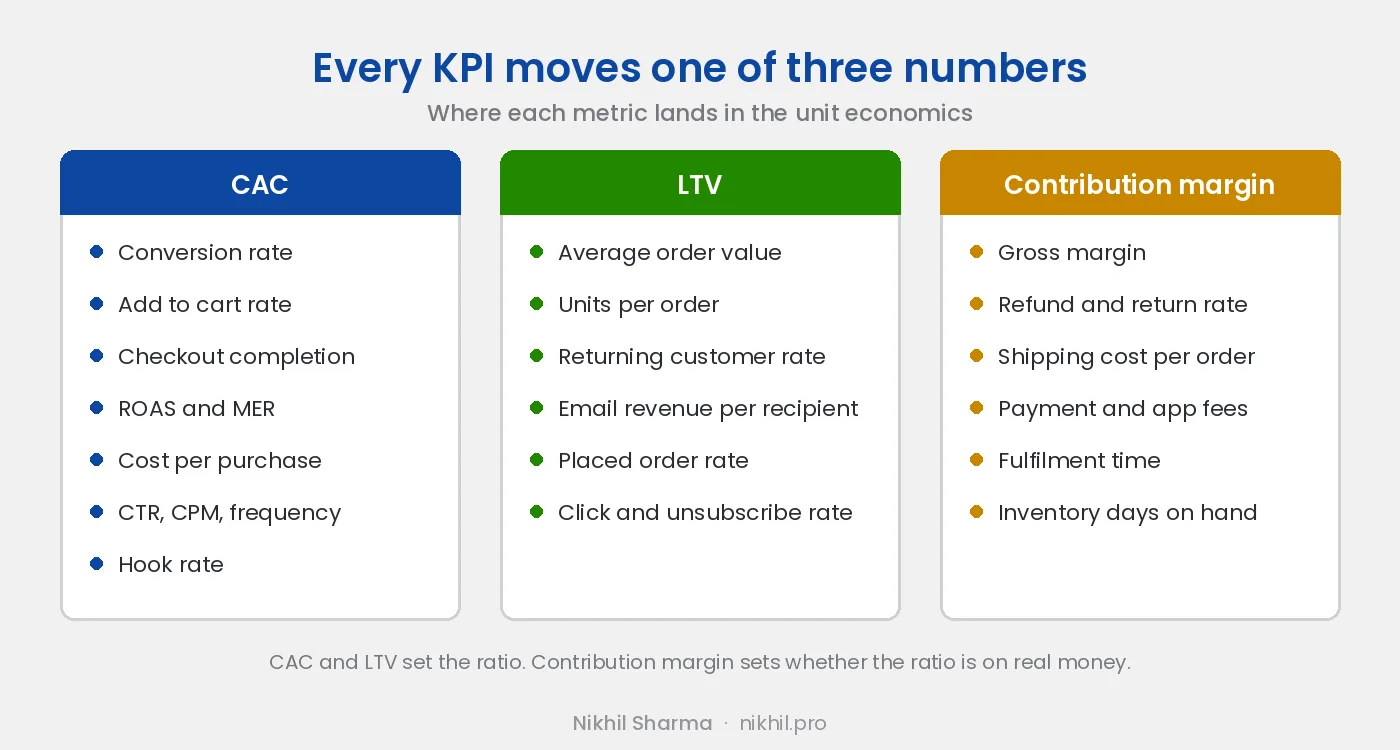
That is the economics. Every KPI below exists to move one of those numbers.
Part 2: Store KPIs
These live in Shopify analytics and they move CAC and LTV directly. Where each one is in the admin, without an app, is its own post.
The funnel
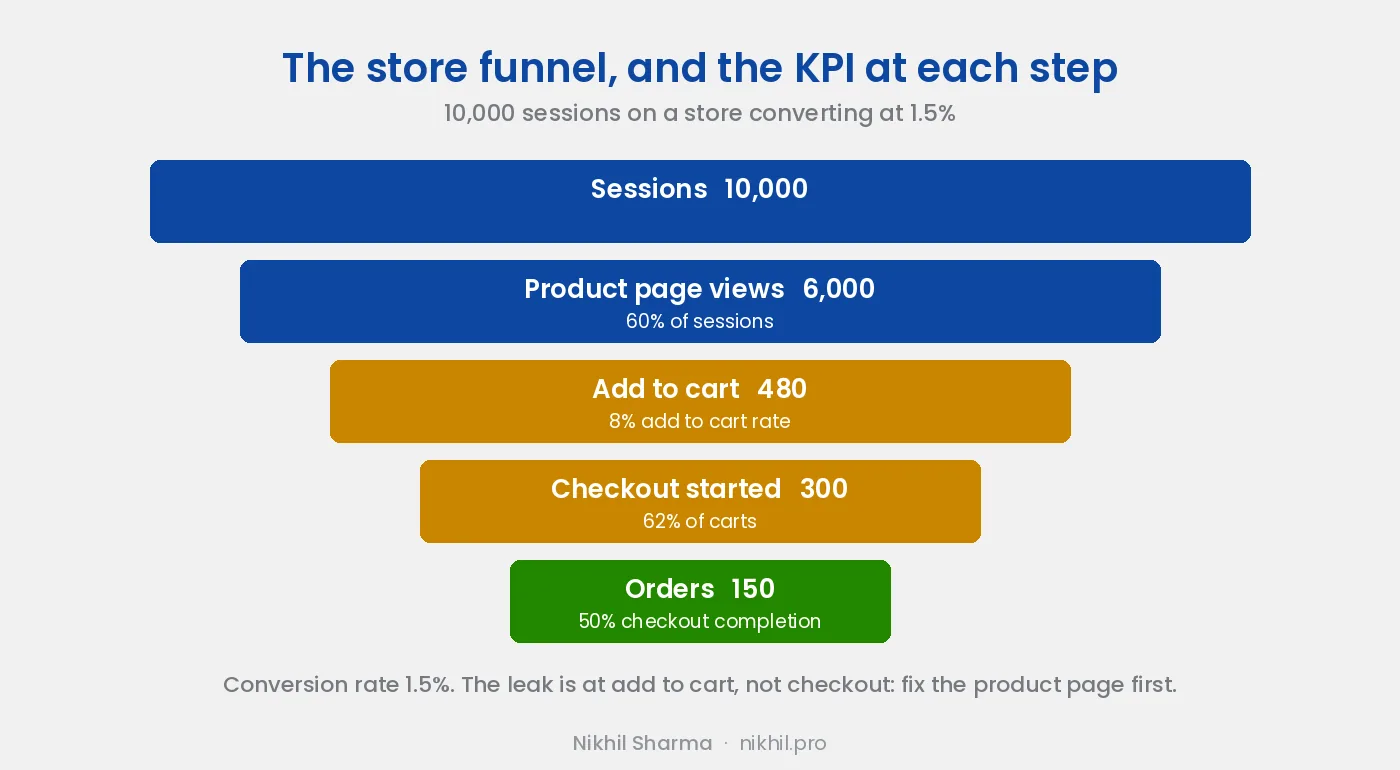
Conversion rate is orders divided by sessions, and most stores sit between 1 and 2 percent. Below 1 percent on paid traffic is a product page, trust or tracking problem before it is a traffic problem. The stores I have rebuilt went from around 1.3 to just over 3 percent, and it came from tracking repairs, product page rewrites and checkout work rather than from one clever test. Shopify now has A/B testing in the admin for the testing half, though it stops short of significance.
Conversion rate on its own does not tell you where the leak is, which is why the two steps inside it matter more. Add to cart rate, add to carts divided by product page views, tells you whether the page is doing its job before the checkout gets involved. Under 5 percent on a page that paid traffic lands on means the page is not answering the question the ad raised. Checkout completion rate, orders divided by checkouts started, is the other step. The inverse is cart abandonment, which runs around 70 percent across ecommerce and is a less useful way of looking at the same thing. Below 40 percent completion, look at the shipping cost reveal, forced account creation and payment options, in that order, and let the abandoned checkout flow in email recover some of the rest.
Order value
Average order value is revenue divided by orders, and it moves with bundles, free shipping thresholds and post purchase offers. The reason it matters is in Part 1: at a fixed CAC, every extra dollar of AOV goes straight to contribution margin. Raising AOV from $60 to $72 in the example above takes margin after marketing from $11 to around $18. Units per order, items divided by orders, is the cleaner way to see whether bundles and cross sells are the cause, because AOV can rise on price alone.
Retention and returns
Returning customer rate is orders from customers with a previous order, divided by all orders, and Shopify shows it on the overview. Under 20 percent means the store lives on acquisition and LTV is close to first order value. Above 35 percent the economics change, because a third of revenue arrived without a CAC attached.
Refund and return rate, by product, is the cost that lands after ROAS was reported, which is why platform ROAS flatters stores with high returns. A product returning at 15 percent may have negative contribution margin while looking like a winner in Ads Manager.
Part 3: Paid ads KPIs
These live in Meta and Google. They explain CAC. None of them replaces MER.
What the platform reports about money
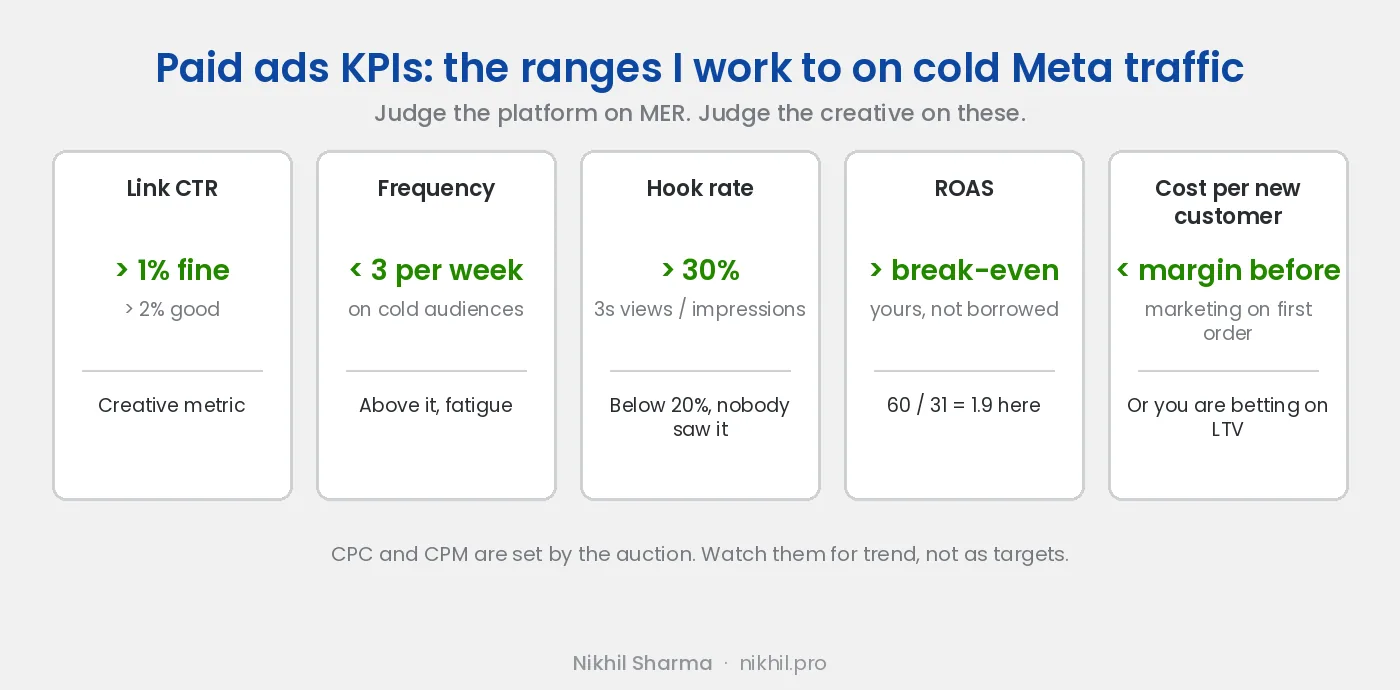
ROAS per platform is revenue the platform attributes divided by spend. It is useful for comparing campaigns inside one platform and not useful for judging the platform, because each one counts generously and they overlap. Compare it against the break-even ROAS from Part 1, and reconcile it against MER monthly. Cost per purchase, spend divided by purchases, is the sharper view per campaign, and the sharpest is cost per new customer, which Meta reports if you have set up the existing customer list in the account. Retargeting always has a low CPA because it catches people who were coming back anyway.
What the platform reports about creative
Click through rate, clicks divided by impressions, is a creative metric. On Meta, link CTR above 1 percent on cold traffic is fine and above 2 percent is good. A low CTR with a good conversion rate means the ad is filtering well; a high CTR with a poor conversion rate means the ad promised something the page does not deliver. On video, hook rate, three second views divided by impressions, decides whether anything else matters. Above 30 percent the first frame is stopping the scroll. Below 20 percent, nobody saw what came after.
Frequency is the average number of times one person saw the ad in the period. Above 3 on a cold audience in a week and ad fatigue is close: CTR falls, CPC rises, and the fix is new creative rather than a new audience. The creative similarity post covers why new creative that looks like the old creative does not reset it.
CPC and CPM, what a click and a thousand impressions cost, are mostly set by the auction rather than by you. Watch them for trend. A CPM up 40 percent in a month on the same audience is competition or seasonality, and the budget plan should reflect it, but it is not a target.
Part 4: Email and SMS KPIs
These live in Klaviyo. Email revenue is the cheapest revenue a store has, which is why these matter more than their size suggests.
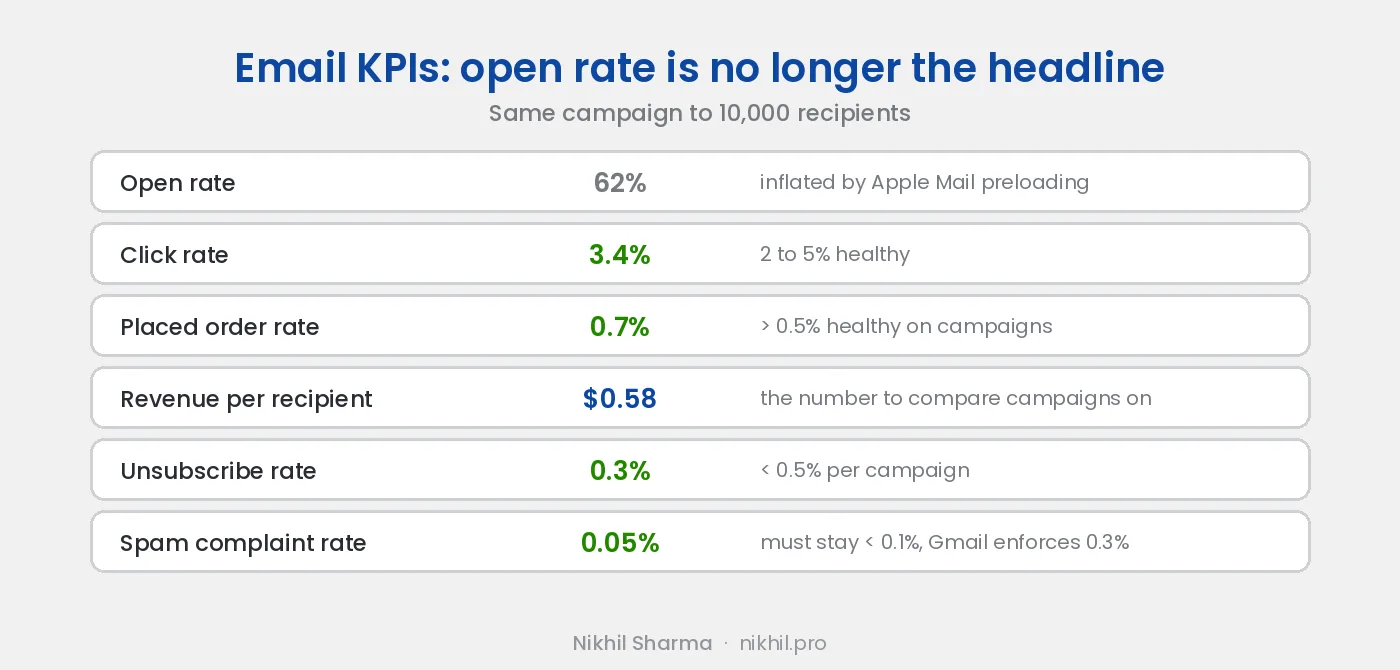
The number to compare campaigns on is revenue per recipient, campaign revenue divided by emails sent, because it is the only one that lets you weigh a send to a thousand people against a send to ten thousand. On a list grown from the checkout it runs several times higher than on a list grown from popups. Placed order rate, orders divided by emails delivered, is the email equivalent of conversion rate. Above 0.5 percent on a campaign is healthy for most stores, and abandoned checkout flows run far higher because the recipient was already buying.
Click rate, 2 to 5 percent on campaigns, replaced open rate as the engagement metric once Apple Mail Privacy Protection started preloading emails and counting the preload as an open. Open rate is still shown everywhere and still means less than it did. It is now a deliverability signal: if it collapses, you are in spam. It no longer tells you whether people read.
Most of the email revenue on a well run store comes from five automated flows rather than campaigns, and flow analytics in Klaviyo report the same numbers per flow.
Two numbers work in the other direction. Unsubscribes should sit under 0.5 percent per campaign, and a rising rate is a content problem. Spam complaints must stay under 0.3 percent and should stay under 0.1, because Gmail enforces that threshold and routes the whole domain to spam when it is crossed. A rising complaint rate is a list source problem, not a content one.
Part 5: Operations KPIs
Nobody puts these on the marketing dashboard. They eat contribution margin quietly.
Shipping cost per order, what you paid the carrier including the surcharges, is on most DTC stores the second largest cost after product. Track it as a percentage of revenue too. Carrier invoices contain errors in the carrier’s favour often enough that auditing them is a recurring source of recovered margin. Fulfilment time, hours from order to carrier scan, drives delivery estimate accuracy, which drives conversion rate and the support ticket rate. Under 24 hours on business days is the target for a store that ships from stock.
Support tickets per hundred orders is the number that tells you whether something upstream is broken. Under 5 is a well run store. Above 15, the cause is usually delivery estimates or product page clarity, and the tickets will say which if someone reads them. Inventory days on hand, units in stock divided by daily sales rate, closes the loop: a stockout on the product the ads are running on wastes the spend, and too much stock ties up the cash that was going to pay for next month’s acquisition.
The dashboard I would actually build
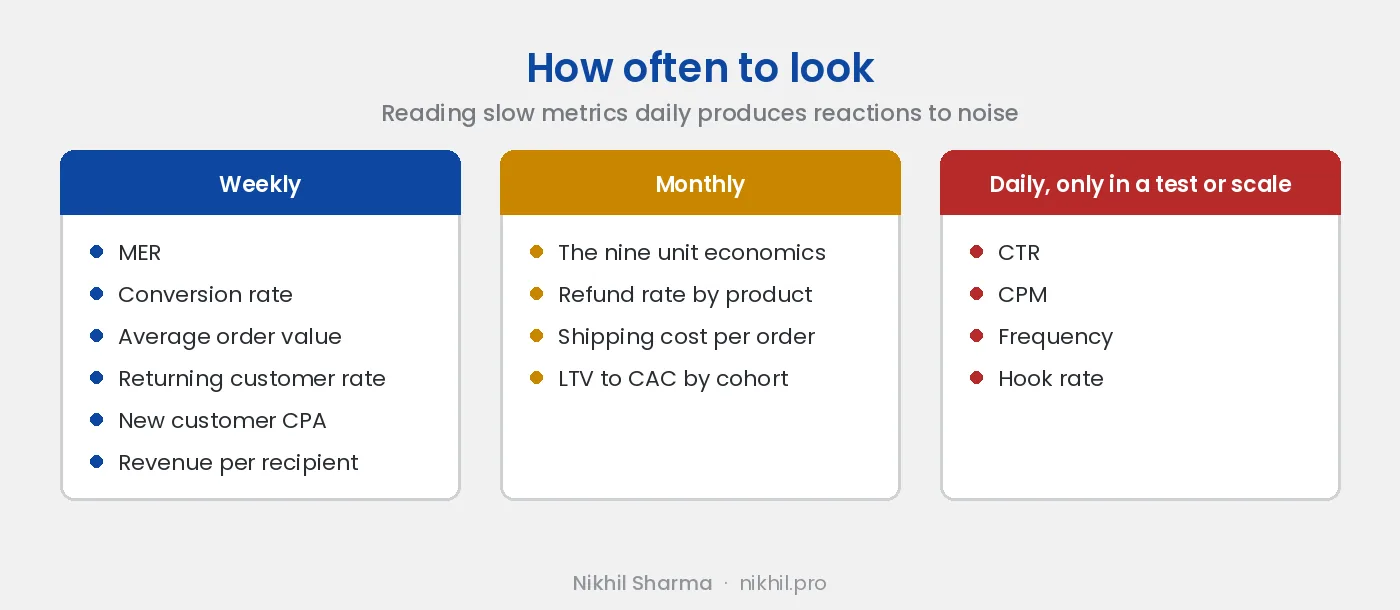
Six numbers weekly: MER, conversion rate, AOV, returning customer rate, new customer CPA and revenue per recipient. Monthly, the unit economics from Part 1, refund rate by product, shipping cost per order, and LTV to CAC by acquisition cohort. The creative metrics, CTR, CPM, frequency and hook rate, only daily and only on the campaigns in a test or a scale. Daily readings of slow metrics produce reactions to noise, and reactions to noise are how most ad accounts get worse.
If you want help pulling these out of Shopify, Meta, Google and Klaviyo into one place, that is most of what I do and this page describes how. Book a call and bring last month’s numbers. The first thing we will work out together is your break-even ROAS, because most stores have never calculated it and it changes every decision after.
Frequently asked questions
What are the most important Shopify KPIs to track?
What is contribution margin in ecommerce?
How do I calculate break-even ROAS?
What is MER and why is it better than ROAS?
What is a good conversion rate for a Shopify store?
What LTV to CAC ratio should a Shopify store aim for?
How do I know if my email KPIs are good?
Which KPIs should a new Shopify store ignore?
How often should I review Shopify KPIs?
Get new posts in your inbox
Occasional notes on Shopify, paid ads, and what I learn. No spam.
Thanks. Check your inbox to confirm.

Nikhil Sharma
I run data and operations for a DTC brand on Shopify, consult on Meta and Google Ads, and build AI automations for ecommerce teams. I write about what I build and run.